Samples
Consuming tiles in OpenLayers
The following code can be used to show the generated tile layer in OpenLayers map application.
import TileLayer from "ol/layer/Tile.js";
import WMTS, {optionsFromCapabilities} from 'ol/source/WMTS.js';
import WMTSCapabilities from 'ol/format/WMTSCapabilities.js';

// datasetId is a guid, schemeId is a string that was provided with the request to generate tiles
public static async setupWmtsLayer(datasetId, schemeId) {
  var parser = new WMTSCapabilities();

  // the TileApi class just uses fetch to get the Wmts capabilities document from the endpoint described above
  var capabilities = await TileApi.getTileMetadataWmts(datasetId);

  var parsedCapabilities = parser.read(capabilities)

  var options = optionsFromCapabilities(parsedCapabilities, {
    crossOrigin: "anonymous",
    layer: schemeId // select the correct layer here
  });

  options.tileLoadFunction = tileLoadFunc; // tileLoadFunc is described below

  return new TileLayer({
    isBaseLayer: false,
    noSwitcherDelete: true,
    source: new WMTS(options)
  });
}
dhi-service-id, dhi-project-id, dhi-dataset-id)
The tiling service generates tiles only to the zoom level where the original data do not have to be resampled to finer resolution. You may need to configure your client for optimal display. In OpenLayers, for example, this means using imageSmoothin: false and also maxZoom: <int> for XYZ source or tileGrid or resolutions parameters for WMTS source. In addition to these parameters, the tiles coordinate system should match the client map coordinate system for best display.
options = {
  crossOrigin: "anonymous",
  layer: "<schema-id-string>",
  imageSmoothing: false
  maxZoom: 4
}

const tileLayer =  new TileLayer({
  isBaseLayer: false,
  noSwitcherDelete: true,
  source: new XYZ(options)
});
Loading map vector tiles into the platform
Sample request to generate tiles
openapikey="<replacewithopenapikey>"

curl -L -X POST "https://api.mike-cloud-test.com/api/conversion/upload-convert" \
  -H 'Content-Type: application/json' \
  -H "dhi-open-api-key: $openapikey" \

  --data-raw "{
  \"projectId\": \"your-project-id\",
  \"uploadUrl\": \"http://sas-url-to-your-zip-archive\",
  \"outputDatasetData\": {
    \"name\": \"dataset-name\"
  },
  \"readerName\": \"FileReader\",
  \"writerName\": \"VectorTilingZipWriter\",
  \"writerParameters\": []
}"
Data source for windy-like components
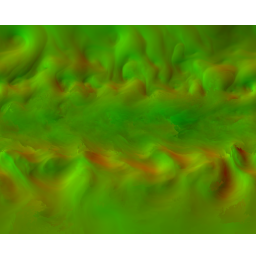
In order to support visualization components like Windy.com, multiple data sources/variables must be combined into a single raster. Typically the north and east components of wind or current speed are each placed into a single band of the bitmap raster. The tiling mechanism supports this with itemBandMapping property, which allows assigning individual items to bands in the output raster.
For example, when using NOAA GFS data, this request will generate XYZ tiles with the "u" and "v" components of the wind speed into one image:
{
  "uploadUrl": "...",
  "outputDatasetData": {
    "name": "noaa-gfs-with-tiles"
  },
  "projectId": "...",

  ### reader parameter is used just to filter out all unrelevant items
  "readerParameters": [
    {
      "name": "AllowedItemNames",
      "value": [
        "u-component of wind @ Tropopause",
        "v-component of wind @ Tropopause"
      ]
    }
  ],

  "writerParameters": [
    {
      "name": "Schemes",
      "value":
        [
          {"schemeType":"XYZ","schemeId":"uv-wind-xyz","outputType":"PNG","aggregationMethod":"Mean","tileWidth":256,"tileHeight":256,
          "itemBandMapping":[
          {"ItemName":"u-component of wind @ Tropopause","MinValue":-62.0,"MaxValue":168.0,"BandIndex":2},
          {"ItemName":"v-component of wind @ Tropopause","MinValue":-73.0,"MaxValue":70.0,"BandIndex":1}]}
          ]
    }
  ],
  "readerName": "NoaaGribReader",
  "writerName": "TilingWriter"
}